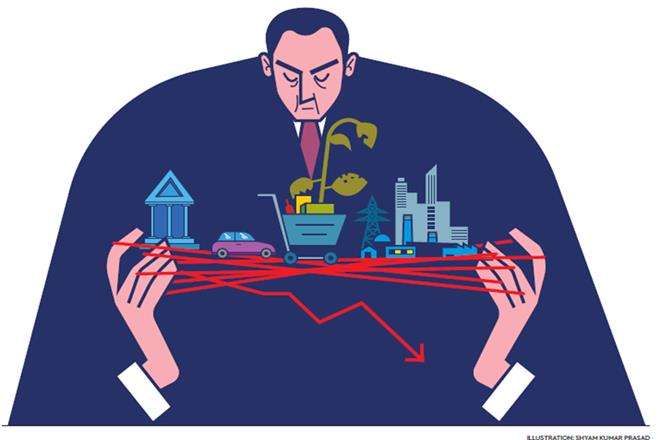
Understanding the investment slowdown

The investment rate in the country has been declining quite significantly over the last six years or so. The gross fixed capital formation (GFCF) rate had peaked at 34.3% in FY12 and then came down to 28.6% in FY18, before registering a marginal recovery to 29.3% in FY19. The story is still an enigma because in the last few years various states have held investment extravaganzas where several MoUs have been signed—for example, Gujarat’s 28,360 MoUs, Tamil Nadu’s worth Rs 3 lakh crore, Karnataka’s Rs 4.5 lakh crore, Uttar Pradesh’s Rs 2.28 lakh crore, Maharashtra’s Rs 12.1 lakh crore, and so on. Yet this rate has stagnated. To better understand this phenomenon, the sources of investment over this time period may be examined in some detail.
The accompanying table shows the distribution of capital formation across various institutions. The two dominant sources of investment in the country have been the household sector and private non-financial companies, which together had a share of 78.3% in FY12, which came down to 74.4% in FY18. Interestingly, the share of private non-finance companies increased by 4% during this period, while that of households declined by 7.9%. Therefore, there was some substitution between the two. The household segment also comprises the unorganised sector entities and hence includes small and medium-sized enterprises (SMEs). It would be possible to surmise that this segment had invested progressively lower amounts in this period.
Private non-financial companies, which are the conventional non-finance companies, increased their share by 4%. As these would be the larger companies in the organised sector, it is a positive sign in terms of what the corporates are doing.
The public sector had a secondary role to play, which, however, had increased in scope during this period. The first is general government, where the share went up from 10.2% to 13.7%, and will get accounted for under the capex of central and state governments. Clearly, during this period, the government has been relatively more aggressive in furthering investment. The PSUs—both financial and non-financial—have maintained their shares in total investment with a slight increase from 10.8% to 11.3%.
The table also shows the CAGR of GFCF for the period FY13-FY18, i.e. the last five years’ growth according to the source of investment. The overall growth in current terms was 6.7%. The comparable growth in nominal GDP during the same period was 11.4%. Therefore, it was but natural that the GFCF rate had come down from 33.4% in FY13 (which is the base chosen for calculating the five years’ CAGR) to 28.6% in FY18.

This growth has been brought down by the household sector where it was just 3.2% while accounting for around one-third of total capital formation. The dual reforms of demonetisation and GST would partly explain why this ratio has declined on account of a slowdown in growth in investment. Private non-finance companies, on the other hand, have grown at 8.6%, which is higher than the sample average, and yet lower than growth in GDP. This may be attributed to a combination of factors involving stalled projects, non-viability of projects post clearance due to changing economic conditions, lower capacity-utilisation rates, and, more importantly, the sharp jump in NPAs of banks as well as referral of several large cases to the Insolvency and Bankruptcy Code (IBC). NPAs peaked at 9.66% in March 2018 after the AQR was put in place. Also, interestingly, the fact that several power and steel companies had been referred to the IBC meant that other companies that were planning to invest had paused in the hope of evaluating the sale of these assets, which also put on hold their fresh capex plans.
The leading sector has been the government, with a growth of 12% during this period, where there was a conscious push made within the confines of the fiscal space available. Here, too, it is the central government that commanded this initiative, as states have had their own set of problems tackling their fiscal numbers on account of UDAY, wherein distribution companies had passed on their debt to the states’ fiscal numbers, which came in the way of their capex plans.
In this context, let us also look at the sectors that have contributed to investment in this period. This information is provided by the CSO for gross capital formation, which also includes change in stocks for the said period. Of the 10 identifiable broad sectors (besides miscellaneous category), seven had witnessed a fall in share. The significant declines were in agriculture (7.7% to 7.2%), mining (2.3% to 1.5%), manufacturing (18.3% to 17.2%), construction (7.4% to 4.2%), real estate (23.9% to 21.9%) and trade hotels repairs (10.6% to 10.1%). Virtually, all non-service sectors witnessed a decline in shares. The fall in the share of agriculture is significant as this was higher in crops; this is indicative of diminishing interest in farming due to growing vicissitudes of crop outcome and prices. This has to be addressed for the viability of the sector in the long run.
The sectors that had improved their shares are public administration (from 7.7% to 10.2%, which is the effort put in by the government relentlessly in the last four years), followed by transport, communication etc, where both communication services and transport witnessed an increase. The former was due to the emphasis put on railways where there were new doses of investment and the latter was due to the telecom revolution that involved a flurry of investment activity commensurate with the progress made on the spectrum side.
Reviving investment on the side of the private sector will be gradual as several issues have to be addressed. First, the financial system involving banks and NBFCs has to get back to normalcy. The latter have been a useful source of finance for the household segment in particular, which includes SMEs. Second, the IBC resolution process has to witness more resolutions with attractive realisations.
Third, capacity-utilisation rates have to show an improvement across the board. The RBI data (FY19) reveals an improvement that is encouraging, though does not gel with the low IIP growth witnessed in the year. Fourth, banks need to regain confidence in lending so that there is a willingness to lend, which is lacking today due to the NPA issue as well as the fear of being haunted by the investigative agencies in case loans go wrong. Fifth, in case of manufacturing, there has to be a revival in demand for companies to think of investing in capital.
Hence, the pace of growth in investment would be slow as far as the private sector is concerned. There will be pressure on the government to step in and provide a fiscal stimulus by expanding the fiscal deficit and enabling additional investment. So far, the focus has been on removing the cogs that are in the way of the private sector, which is commendable. But a direct push of an additional 0.5% of GDP as capex for the next three years will definitely help expedite the process and create backward linkages.
[“source=financialexpress”]